RESILIENT PLANNING
INTEGRATED PERFORMANCE MEASURES
FOR LAND USE AND TRANSPORTATION
METRICS
Available here are two spreadsheet tables of comprehensive metrics or livability indicators and rankings for the 88 urbanized areas (UZAs) and 76 metropolitan statistical areas (MSAs) within/ adjoining the six-state areas of Illinois, Indiana, Michigan, Minnesota, Ohio and Wisconsin. The data, generally covering the years from 1999 to 2010, are from an array of public information sources as outlined in the spreadsheets. These tables include demographics and statistics relating to population, employment, education, income (including by race), gross regional product (GRP), transportation, poverty rate, exports, and housing.
Comprehensive Environmental Sustainability Performance Measures
A study was conducted, Weighted Population Density as a Transportation Performance Measure (WPD Study), using these six-state area metrics to determine their association with the proportion of per capita personal income (PCPI) dedicated to transportation (dependent variable). Multi-variable regression analysis was performed to identify the following independent variables as having statistically significant relationships with the dependent variable: population clustering as measured by weighted population density (WPD); employment rate; per capita exports; and a binary value for the proportion of population made up by college students. The study identifies a number of other metrics in the above referenced tables that show positive associations between physical form of the built environment, as measured by WPD, and various quality of life measures.
Weighted Population Density as a Transportation Performance Measure
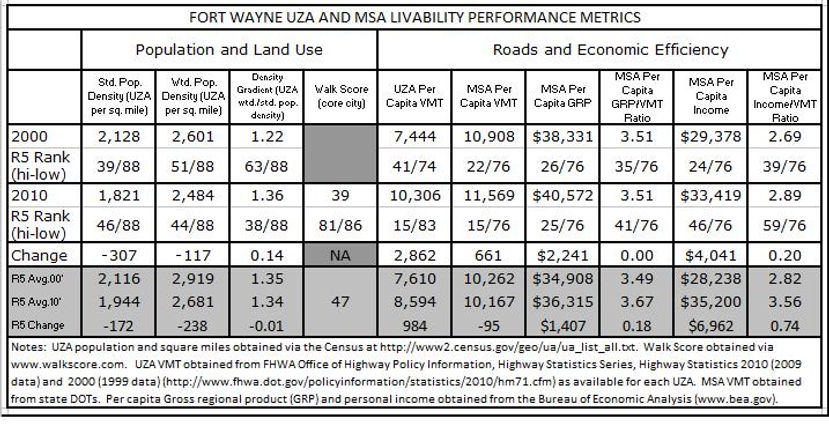
The table below shows a methodology for documenting overall quality of life or livability in a particular area, Fort Wayne MSA/UZA, against others within the six-state region. It includes data for the years 2000 and 2010 in addition to changes between these periods.
In the first portion of the table, data including rankings are provided for the following UZA population/land use metrics: standard population density (SPD); weighted population density (WPD); and density gradient (DG). WPD is an indicator of population clustering. It is calculated by determining the population of each Census tract in a UZA, weighting each by the proportion of persons in a tract, and then adding the totals. DG is WPD divided by SPD, with higher measures indicative of more “unevenness” in the distribution of population. WPD and DG tend to rise together. Walk Score (www.walkscore.com) is a measure of walkability to community amenities. The city of Fort Wayne’s Walk Score is 39 which ranks it 81st out of 86 and below the six-state core city average of 47. WPD is a critical indicator as it has a stronger inverse association with the proportion of household expenditures dedicated to transportation than both SPD or DG as demonstrated by the WPD Study. The table shows that Fort Wayne had a drop of 117 in WPD from 2000 to 2010, which was less than the six-state average reduction in this metric. Consequently, Fort Wayne’s WPD ranking improved from 51st to 44th.
The second segment of the table analyzes relationships between per capita vehicle miles traveled (PCVMT), gross regional product (PCGRP), and per capita personal income (PCPI). At the UZA level, Fort Wayne’s PCVMT increased dramatically by 2,862 from 2000 to 2010, which was almost three times the six-state average increase of 984. This moved the Fort Wayne UZA from 41st to 15th in terms of highest PCVMT. The same analysis performed at the MSA level found that Fort Wayne’s PCVMT increased 661 during the period compared to an average drop of 95 for the six-state area. Accordingly, the Fort Wayne MSA ranking moved from 22nd to 15th in terms of highest MSA PCVMT in the six-state region.
The table indicates that the Fort Wayne MSA’s increase in PCGRP was above the six-state area average increase, however, its ranking remained about the same. Next, the ratio of PCGRP/PCVMT is calculated. The Fort Wayne MSA performed slightly below the six-state average in this metric from 2000 to 2010, and its ranking fell due to the substantial increase in PCVMT. The same methodology is then replicated using PCPI and PCVMT. The Fort Wayne MSA’s increase in PCPI was less than the six-state regional MSA average increase, which moved the area down from 24th to 46th in this metric from 2000 to 2010. Consequently, the Fort Wayne MSA experienced a slight increase in PCPI/PCVMT ratio, which was less than the six-state average increase in this metric. Accordingly, the Fort Wayne MSA’s ranking in this metric dropped from 39th to 59th.
The analytical approach to these statistics is invaluable for tracking community well-being in terms of the level of transportation, as measured by PCVMT, used in achieving PCGRP and PCPI. From the above referenced study, it is clear that growth and development focused on increasing WPD can assist planners in predicting quantitative household reductions in transportation expenditures as a proportion of PCPI. The study can also be useful in predicting PCGDP as the metric is closely related with PCPI. Generally, reducing PCVMT is a legitimate planning objective as less cost for transportation makes additional funding available for other household expenditures. More importantly, as demonstrated by the WPD Study, increasing household transportation expenditures do not result in sufficient improvements in PCPI to justify the costs.